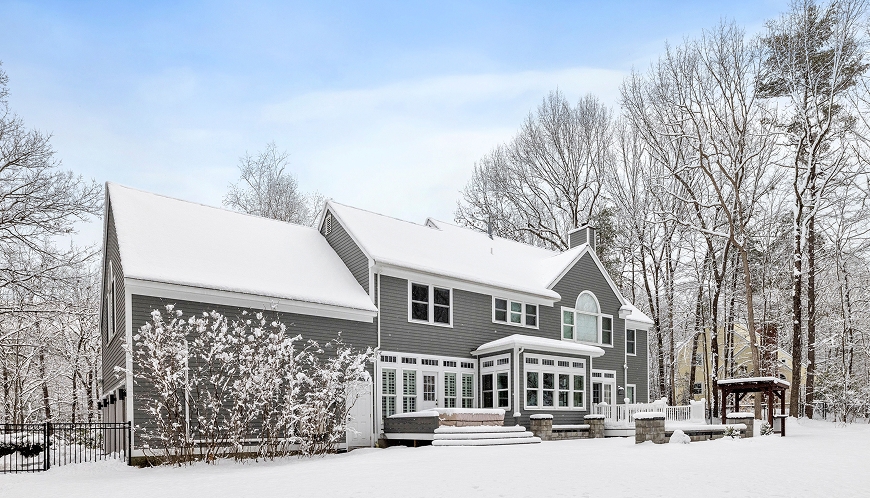
Markets that have stayed hot as the temps drop

As the days get shorter, weather gets cooler and the leaves start to change colors, homebuying tends to cool off as well. In most years, the housing market is busiest during the spring and summer, and by the time the kids get back to school, the number of buyers looking for a home dwindles.
But this year has been a little different.
While buyers were waiting for mortgage rates to drop in the spring and summer, homebuying activity wasn’t as busy as previous years. That lead to a much-needed buildup of homes for sale. The number of homes for sale, also called housing inventory, is at its highest level since April 2020, during the early months of the pandemic. And when mortgage rates started to drop at the end of summer, mortgage applications started to increase as buyers were encouraged because they were finally able to afford to buy a house.
As we’ve seen by this surge in homebuying activity, this fall is shaping up to be a great time to buy a home. Sellers may also find that the current climate is a good time to list their home. And some markets are proving to be hotter than others as these factors play out throughout the country. If you find yourself in a hot market, PowerBid Approval can help make your offer stand out and compete with other buyers, even all-cash buyers.
What makes a market hot?
While the trends outlined above apply across the country, there are unique characteristics of every city and town that might make now a better time to buy where you live than other places. Areas that are seeing strong job growth or income growth, for example, are more likely to see more folks looking to buy a home.
Some other factors that may induce greater homebuying activity include lower home price growth, more renters who are able to afford a home in your city and more potential sellers. A big factor is the number of homes for sale. Buyers can’t purchase homes that aren’t for sale.
Defining a hot market
So, what makes a hot market? We took a look at a couple of factors. The first way to look at the “hotness” of a market is to quantify how eager homebuyers in the area are about getting a home. We’ll measure that by days on the market, which looks at the median number of days that listings lasted on the market in specific metro areas.
We also want to measure demand, which we are doing with a statistic called median listing price per square foot. We’re looking at how that price has changed from August 2024 to September 2024 to see how much buying activity has driven prices up. Price per square foot is the most effective metric for comparing home costs in different markets. That’s because it takes into account the size of the home and gives you a better idea of how far your purchase budget will go.
A simple example of the value of price per square foot is thinking about the difference between a million-dollar home in San Jose, California, the heart of Silicon Valley, and Indianapolis, Indiana. In the former, you would expect to buy a bungalow or something similar for those million dollars, in the latter, a mansion. Price per square foot gives you more of an apples to apples comparison.
We looked at data from the Realtor.com team. We looked at the top 200 housing markets across the country, and picked out the ones that showed a combination of fewest days on the market with the biggest increase in prices, as measured by price per square foot, from August of 2024 to September of 2024.
San Jose, CA
- Median days on market: 31
- Change in price per square foot: 1.76%
- Median listing price: $1,432,170
In high-cost areas like San Jose (31 days on market) and Seattle (43 days on market), homes are staying on the market longer. Even though these areas are desirable, the higher cost of homes may be slowing down transactions, as fewer buyers may be able to afford them. But the demand is apparent as the prices of homes have gone up significantly in these cities.
Manchester, NH
- Median days on market: 25
- Change in price per square foot: 1.40%
- Median listing price: $563,475
Markets like Manchester (25 days on market) and Springfield (28 days on market) have homes selling quickly, reflecting strong demand. These areas may offer a combination of affordability and proximity to larger metropolitan areas, making them attractive for buyers.
Oshkosh, WI
- Median days on market: 35
- Change in price per square foot: 2.42%
- Median listing price: $304,900
Cities like Oshkosh (2.42%) and Greensboro (13.35% price growth) are experiencing some of the highest increases in price per square foot, despite having more affordable overall prices compared to larger, high-cost markets. This suggests that smaller or more affordable markets are in high demand, driving up home values faster than in already expensive markets.
Springfield, MA
- Median days on market: 28
- Change in price per square foot: 1.12%
- Median listing price: $393,349
San Francisco, CA
- Median days on market: 33
- Change in price per square foot: 1.30%
- Median listing price: $997,500
Expensive markets like San Francisco, including Oakland and Berkeley, (1.30%) Washington, DC (0.48%) and Boston (1.10%), have seen relatively modest growth in price per square foot compared to more affordable regions. This suggests that overall demand in higher-cost markets is stabilizing, possibly due to affordability challenges. But the days on market shows that there are still many eager buyers in these high-cost towns.
Rockford, IL
- Median days on market: 29
- Change in price per square foot: 1.04%
- Median listing price: $223,225
Cities like Rockford (1.04%), South Bend (1.63%) and Cleveland (1.36%) show moderate price growth, indicating steady demand in the Midwest, which has been the most affordable region in the country for awhile now.
Boston, MA
- Median days on market: 31
- Change in price per square foot: 1.10%
- Median listing price: $839,900
Milwaukee, WI
- Median days on market: 31
- Change in price per square foot: 0.82%
- Median listing price: $389,900
Worcester, MA
- Median days on market: 30
- Change in price per square foot: 0.74%
- Median listing price: $524,900
Hagerstown, MD
- Median days on market: 40
- Change in price per square foot: 2.17%
- Median listing price: $346,888
Cleveland, OH
- Median days on market: 39
- Change in price per square foot: 1.36%
- Median listing price: $262,213
Allentown, PA
- Median days on market: 39
- Change in price per square foot: 1.30%
- Median listing price: $386,998
Lancaster, PA
- Median days on market: 37
- Change in price per square foot: 0.75%
- Median listing price: $403,450
Washington, DC
- Median days on market: 36
- Change in price per square foot: 0.48%
- Median listing price: $599,948
Greensboro, NC
- Median days on market: 44
- Change in price per square foot: 13.35%
- Median listing price: $335,123
South Bend, IN
- Median days on market: 43
- Change in price per square foot: 1.63%
- Median listing price: $263,725
Seattle, WA
- Median days on market: 43
- Change in price per square foot: 1.37%
- Median listing price: $772,425
Modesto, CA
- Median days on market: 43
- Change in price per square foot: 1.24%
- Median listing price: $528,950
Binghamton, NY
- Median days on market: 42
- Change in price per square foot: 0.98%
- Median listing price: $236,400
Joplin, MO
- Median days on market: 41
- Change in price per square foot: 0.87%
- Median listing price: $252,225
The coldest housing markets in the country
If you’re curious, here are the coldest housing markets in the country. Homes here are languishing on the market and are seeing their prices come down. It’s probably not a coincidence that 4 of the bottom 5 cities are in Florida and Texas, considering the devastating hurricane season that part of the country has seen in 2024.
196. Panama City, FL
- Median days on market: 94
- Change in price per square foot: -2.52%
- Median listing price: $437,774
197. Naples, FL
- Median days on market: 96
- Change in price per square foot: -1.87%
- Median listing price: $749,000
198. Corpus Christi, TX
- Median days on market: 86
- Change in price per square foot: -1.90%
- Median listing price: $347,869
199. Bend, OR
- Median days on market: 81
- Change in price per square foot: -1.79%
- Median listing price: $736,198
200. Cape Coral, FL
- Median days on market: 83
- Change in price per square foot: -1.33%
- Median listing price: $430,000
Handling a hot market
If you’re in one of these hot markets and you’re looking to buy a home, it’s important to approach the process strategically. Make sure you can stand out against fierce competition and where homes sell quickly by getting a PowerBid Approval and being prepared to move fast.
Applicant subject to credit and underwriting approval. Not all applicants will be approved for financing. Receipt of application does not represent an approval for financing or interest rate guarantee. Refinancing your mortgage may increase costs over the term of your loan. Restrictions may apply. Savings, if any, vary based on the consumer’s credit profile, interest rate availability, and other factors. Contact Rate for current rates. Restrictions apply.

.jpeg)


